In the Computational Nanomaterials group, we conduct research in numerical modeling and design of nanomaterials. This page introduces some of our our work.
This work is carried out in the SunTune project.
The main idea in SunTune is to use upconversion to enable solar cells to use more of the solar spectrum.
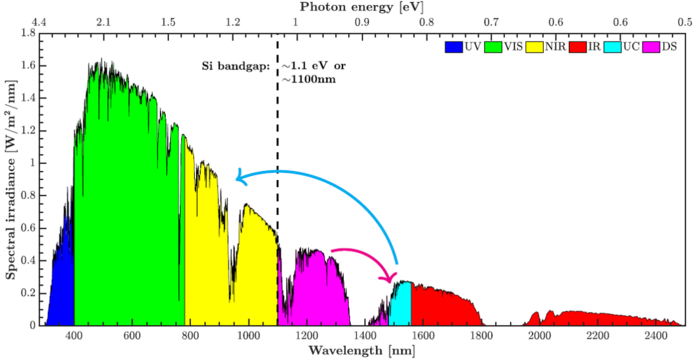
The figure below shows the sunlight spectral irradiance as a function of wavelength (bottom) and photon energy (top).
The >1100 nm parts of the sunlight are lost in standard Si solar cells because the wavelength is too long/energy too small.
Increasing the efficiency of Si cells by a few percentage points should be possible and industrial relevant.
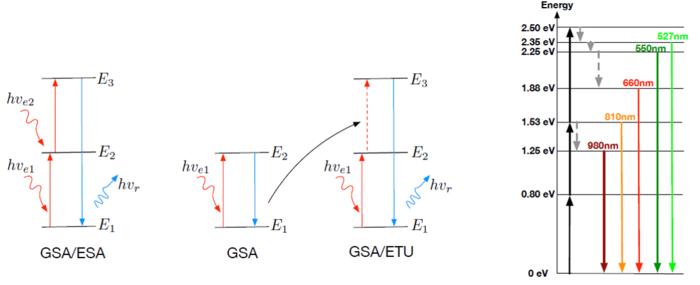
The energy levels of Erbium makes it possible to absorb ~1500 nm light and emit light at ~980 nm and lower wavelengths. Several excitation processes are relevant for the upconversion.
The enhancement due to nanoparticles of the upconversion signal can be calculated simply as
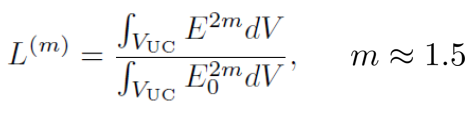
where E is the electric field with nanoparticles and E0 is without nanoparticles. VUC is the domain which includes the upconverting ions.
The electric field is calculated by solving Maxwell's equations, by first reducing them to the electric wave equation
![]()
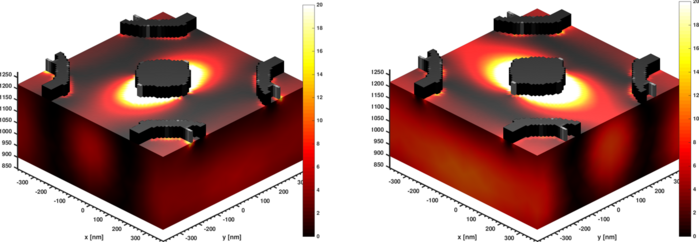
The images below shows an example of nanostructures on top of a thin film for two different polarizations of the incoming light. The enhancements of the electric field due to the nanostructures is clearly seen as the yellow-white areas.
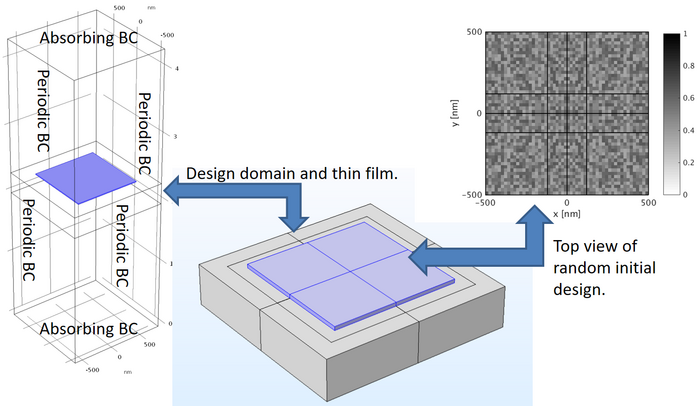
The enhancement depends on the shape and size of the nanostructures. To find very efficient structures, topology optimization is employed. A typical setup is shown below.
Topology optimization thus lead to an automated way of locating efficient nanostructures for electric field enhancement, where the optimizer exploits the available physical mechanisms for field concentration. The animation below show the steps taken by the optimization algorithm and one clearly sees an enhancement of the electric field in the thin film.
ERROR: Content Element with uid "687997" and type "media" has no rendering definition!
This work is done in the MagFly project.
We study the microscopic behavior of magnetic materials using the Landau-Lifshitz-Gilbert equation
![]()
defined in a domain Ω. The equation describe the time-evolution of the magnetization, m(r,t). In a ferromagnet, the magnetization is everywhere equal to the saturation magnetization, Ms. γ is the gyromagnetic ration and α>0 is a phenomenological damping parameter.
Heff is the effective magnetic field, which can be decomposed to
![]()
Hex is the exchange field, modeled as
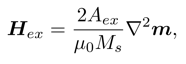
with Aex being the exchange constant.
Hdemag is the demagnetization field, found by solving Maxwell’s equation in the magnetic scalar potential approximation

Han is the anisotropy field, which for uniaxial anisotropy can be written as
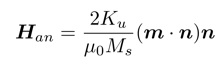
where n is the easy axis and Ku is the anisotropy constant.
The equations are solved using the finite element method in the open source software Fenics using a solver based on PETSc's field-split feature.
Magnetization curves
In many cases we calculate M-H curves. These are found by minimizing the energy associate with the dynamic equation above, often done by dynamically evolving the magnetization until steady state for large damping.
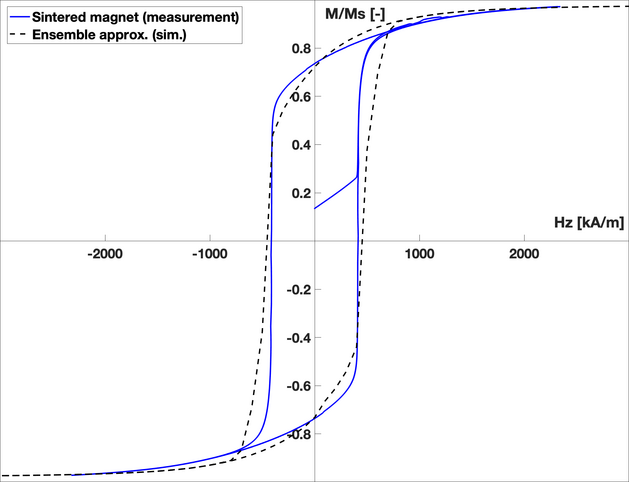
The magnetization curve for a single-domained nano-sized ferromagnet magnetized along the easy axis generally show a perfect square hysteresis loop, e.g.
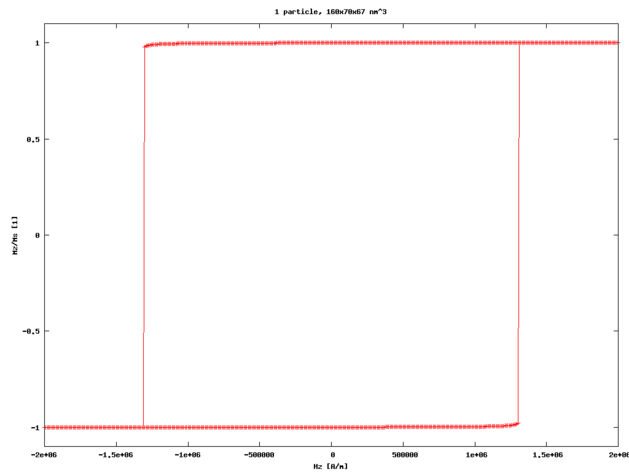
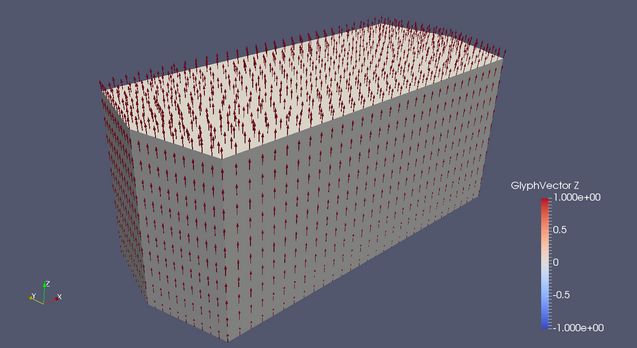
The solid color show the surface of the platelet and the arrows show the magnetization vectors, which fills the entire volume of the platelet.
Real nanostructured magnets will have an ensemble of nano-sized domains and the magnetization curve is generally a lot different than the one shown above. To model a realistic magnetization curve, we perform many single-domain calculations for different angles of rotation and perform an averaging to get a more realistic looking magnetization curve: